As more business-critical applications are being deployed, organizations are increasingly looking to gain visibility into network and application performance and, more importantly, improve usability of this information. Visibility into network and application performance has been identified as one of the top concerns for end-user organizations in the coming year, according to the September Aberdeen report, "The Value of Network and Application Visibility."
While businesses are currently using six applications considered business-critical, an additional four are expected to be rolled out within the next two years. Even though 85 percent of organizations surveyed for this report said the amount of network and application performance data collected has increased over the last two years, only 54 percent of these organizations improved their ability to resolve issues with network and application performance in a timely manner over the same period of time (see figure).
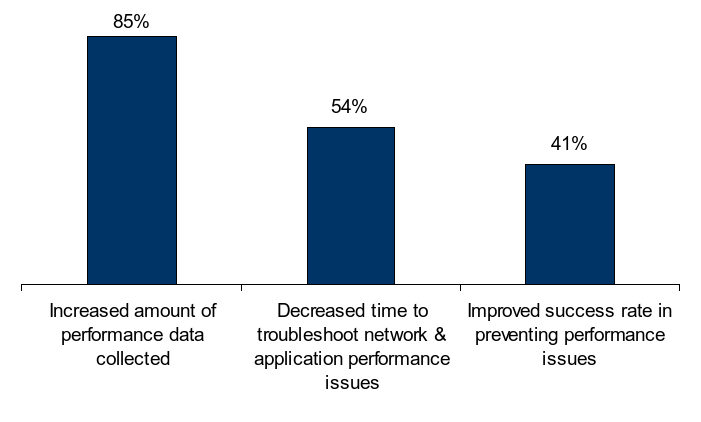 (click on image to enlarge)
"The top challenge for managing application performance is the inability to prevent performance issues before they impact end-users," said Bojan Simic, a network and application performance management research analyst at Aberdeen Group. "The research also revealed that the top obstacle for achieving full visibility into network and application performance that organizations are currently experiencing is caused by a lack of the ability to identify and eliminate performance bottlenecks before applications are rolled out on the network."
As organizations are looking to be more proactive when managing network and application performance, they are increasingly realizing the need to start gaining visibility into performance related issues before conducting new technology rollouts.
Additionally, organizations are becoming increasingly concerned about the impact that their wide area network (WAN) optimization and virtualization initiatives are having on the ability to achieve full visibility into network and application performance, because "both of these initiatives are causing new sets of challenges for network and application performance visibility," Simic said.
Choosing the Right KPIs
Organizations are increasingly looking to evaluate their success in managing network and application performance from the perspective of business end-users, he said.
Nearly one-fourth of organizations reported that they are looking to improve network and application visibility to support their long-term plans for managing application performance. These organizations are looking to gather actionable information on network and application performance so they can make educated decisions about optimizing their networks for new technology rollouts and changes to the network design that they plan to conduct in the future.
Aberdeen's Benchmark report, "Application Performance Management," also written by Simic, revealed that only 42 percent of organizations are satisfied with the performance of business-critical applications.
"This report also showed that almost two-thirds of these organizations didn't have the capabilities for measuring and analyzing application response times," he said, while Best-in-Class organizations (those organizations that are in the top 20 percent of the aggregate based on key performance indicators) are more likely to use application response times, as well as application availability, quality of end-user experience, and application service level agreements (SLA) when evaluating their network and application visibility initiatives.
On the other side, Industry Average and Laggard organizations are more likely to use the number of end-user complaints, unplanned network downtime and network SLAs as the key performance indicators for network and application performance management. Not identifying the right KPIs is a major reason why these organizations are not as competitive with the Best-in-Class organizations, Simic said.
"The forward-thinking organizations are becoming increasingly concerned about the quality of end-user experiences using business-critical applications, while average and laggards are more interested in reducing downtime and number of complaints," Simic said, which are only small portions of the end-user experience as a whole.
Data Collection - Quality vs. Quantity
Aberdeen's December Benchmark report, "The Real Value of Network Visibility," documented that Best-in-Class organizations experience an average of 152 minutes less network downtime annually as compared to all others.
"This is mostly due to the fact that Best-in-Class organizations are more likely to be selecting the right combination of internally developed processes and technology solutions that allows them to improve visibility into network and application performance," Simic said.
As complexity of managing network performance is increasing, the key for gaining benefits from achieving full visibility into network and application performance is not in the quantity of performance data collected, but in developing capabilities that would allow organizations to improve usability of this information.
"Over the last two years, almost half of the organizations increased the amount of data they collected on network and application performance, and they experienced no improvements in their ability to prevent performance issues, showing us that developing capabilities is key to improving actual performance," Simic said.
As a result of having this capability in place, Best-in-Class organizations reported an average 85 percent success rate in preventing issues with network and application performance as compared to a 13 percent success rate for Laggard organizations.
Efficient and Effective
"Time and time again, Best-in-Class organizations prove their efficiency and effectiveness," Simic said.
According to the September report, these organizations are twice as likely to have the ability to filter network traffic that is being monitored as compared to all others, which allows these organizations to improve usability of performance data by enabling IT staff to sort through thousands of data points collected and find information needed for preventing and resolving performance issues in a timely manner.
As a result of having this capability in place, Best-in-Class organizations are 83 percent more likely to reduce time needed to troubleshoot network performance issues and 75 percent more likely to reduce time to troubleshoot application performance issues as compared to all others. The research also shows that for Best-in-Class organizations, the labor cost to manage the network is 15 percent of overall networking spend, while all other organizations are allocating 24 percent.
Aberdeen's research shows that Best-in-Class organizations are six times more likely to have tools for establishing performance baselines through active learning and nearly four times more likely to be using tools for network anomaly detection as compared to Laggards.
"These capabilities allow end-users organizations to have full control over network and application performance in an automated way and further improve productivity of IT staff and labor cost to manage network and application performance," Simic said.
The research shows that Best-in-Class organizations are, on average, spending US$146 per user annually on labor cost to manage network and application performance while all other organizations are spending $253 per user annually.
Increasing Performance
There are many suggestions on how companies can go from being a Laggard or Average and come out on top.
Most Laggard organizations (82 percent) do not have network anomaly detection capabilities.
"Development of this capability would enable organizations to discover security threats and performance issues through automation," said Simic. "It would also reduce time to identify and resolve network performance issues, while improving productivity of IT staff, and reducing labor cost to manage the network."
Industry Average organizations reported that the top obstacle was an inability to identify performance bottlenecks before applications are rolled out over the network. Even so, 60 percent of these organizations still do not use an emulated network environment for testing application performance in the development and pre-production stages.
"By implementing this capability, organizations could identify potential performance bottlenecks before applications are deployed and prevent performance issues before they impact end-users," Simic said.
Even though Best-in-Class organizations are 64 percent more likely to have the ability to measure quality of end-user experience from using enterprise applications, more than half still do not have this capability. While no industry accepted metric to is used to quantify the level of application performance from the end-user perspective, Aberdeen's research shows that application response times remain the top performance metric that end-user organizations are currently using to measure quality of end-user experience.
"While 94 percent of Best-in-Class organizations have the ability to measure response times for business-critical applications, only 46 percent of these organizations have the ability to measure quality of end-user experience," Simic said. The combination of which would allow Best-in-Class organizations to improve visibility into application performance from an end-user perspective.
Obtain a complimentary copy of the report here.
Andrew Stamer is a research associate at The Aberdeen Group.